
GA4 Debugging: Mastering Google Tag Assistant & DebugView
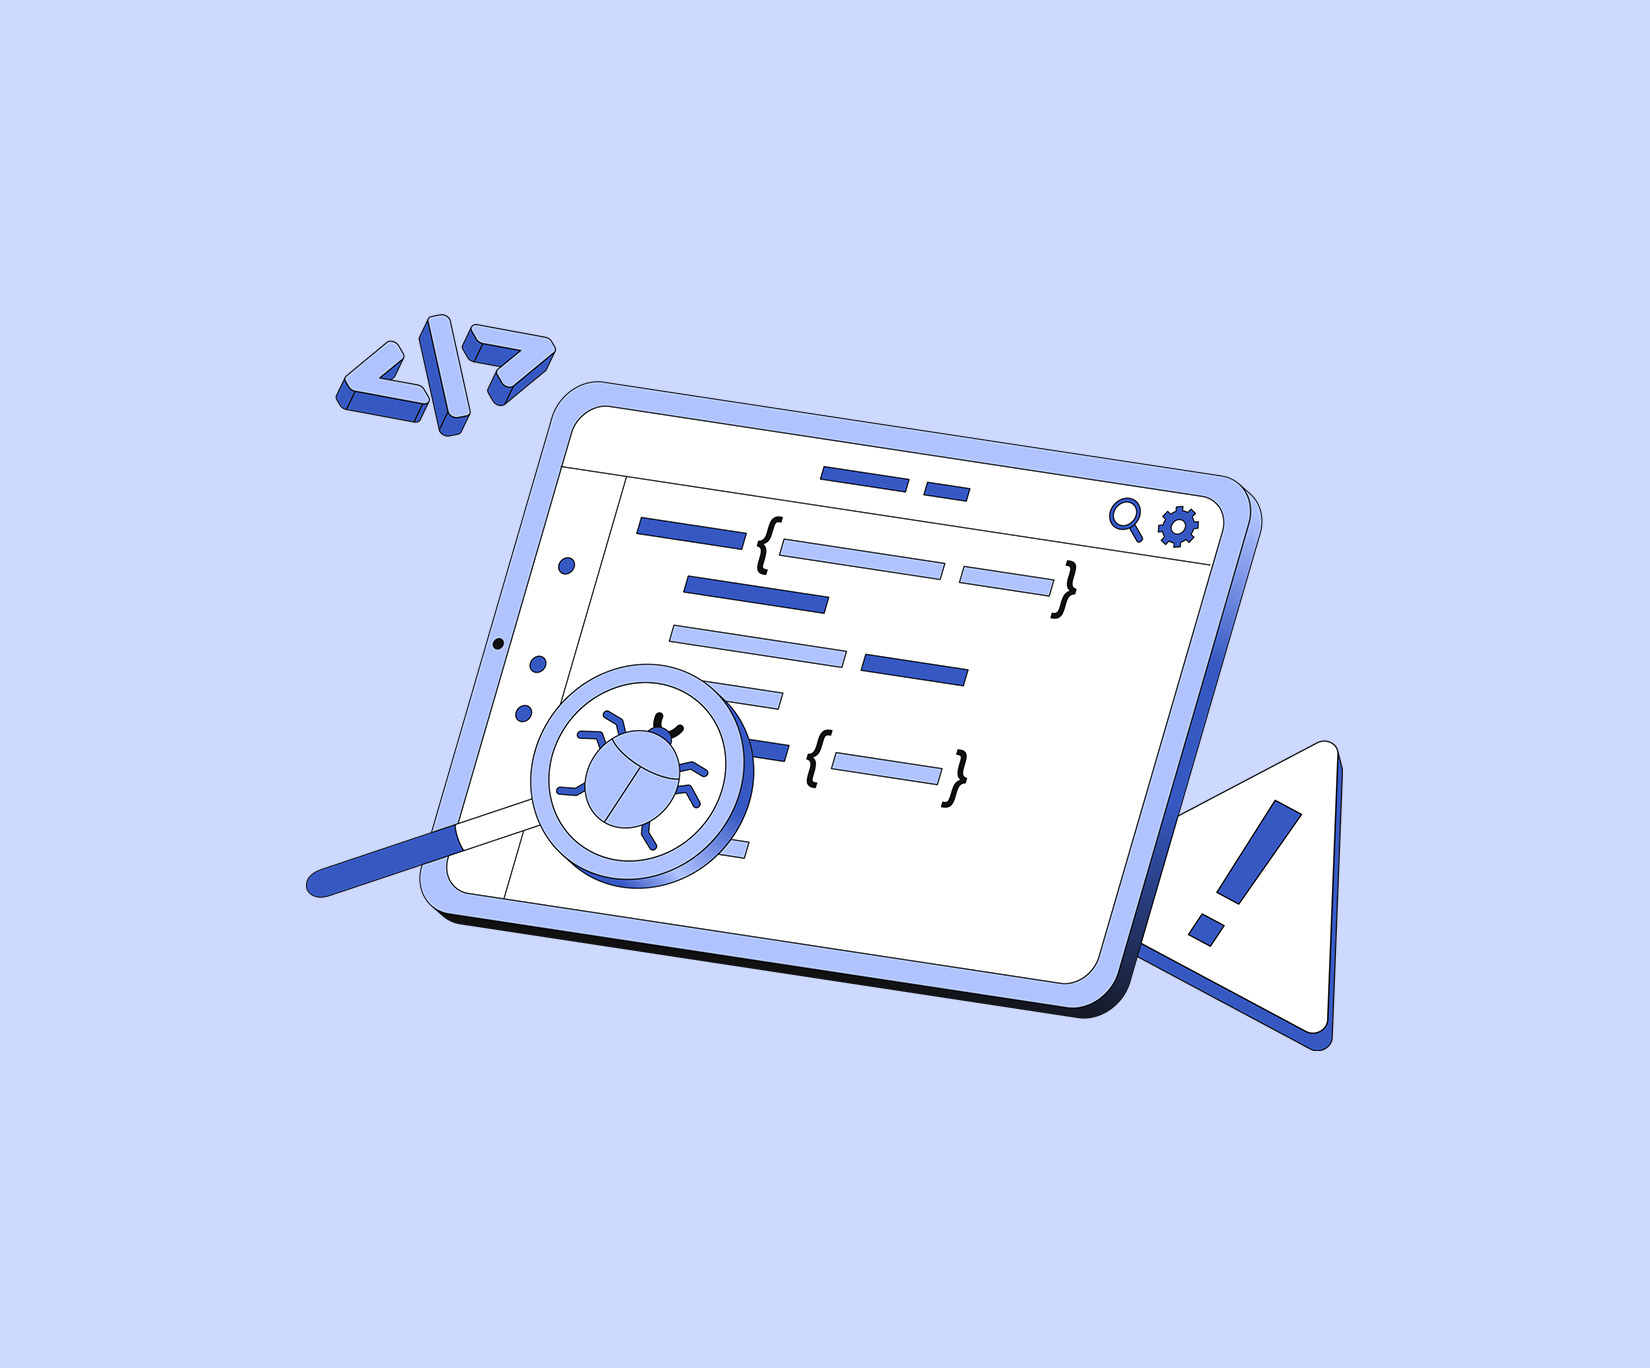
Data is only as good as its accuracy. Digital marketers and analysts know that even the smallest tracking issue can mean inaccurate insights and wasted spend. This is why GA4 debugging is such an important component of any analytics implementation, for if you don’t test and validate your tracking, you’re essentially working with a blindfold on.
GA4 has some powerful methods to help you ensure that the things you intend to track are actually firing appropriately. Two of the most effective analytics debugging tools are Google Tag Assistant and GA4 DebugView. Together, they give you visibility into the real-time flow of events and the technical health of your tags.
In this guide, we will look at how to get the most out of these tools, how to fix some common pitfalls, and why debugging should be an ongoing part of your analytics process.

Why GA4 Debugging is Essential
Google Analytics 4 (GA4) is more complicated than Universal Analytics. Additionally, GA4 is more flexible, leaving room for errors. Mistakes, such as incorrect tags, duplicate events, or missing parameters, can easily find their way into your GA4 setup.
By putting the time into GA4 debugging, you will:
- Avoid incorrect reporting and bad business decisions.
- Have confidence in the data recorded, since you’re able to catch errors before they corrupt your live data.
- Have confidence in GA4, the features you are relying on.
Instead of just crossing your fingers and hoping your setup works, this can be confirmed by using GA4 DebugView and Google Tag Assistant to ensure every event is sent accurately
GA4 Debugging Tools: The Basics
There are two main analytics debugging tools at the center of this process:
- GA4 DebugView: A real-time interface inside Google Analytics that shows you the events sent to your property. It will show you which events fired, which parameters were passed, and so you can see how user interactions are represented in the stream.
- Google Tag Assistant: a browser extension that tests if your tags have been correctly implemented. It not only works with GA4, but you will see it’s especially good for diagnosing tracking and firing conditions.
This article will be a Google Tag Assistant guide, but also show how DebugView is complementary to the Tag Assistant. Together, you will see how they make a full suite for troubleshooting your analytics data collection.
Where to Find GA4 DebugView
Finding GA4 DebugView:
- Sign in to Google Analytics.
- Go to Admin > DebugView.
- From here, you’ll see a live stream of events, parameters, and timings.
It’s also useful to know that DebugView will only show you events that are flagged for debugging; so, if there are no events, that doesn’t mean your tracking is broken; that means debugging has not yet been enabled.
Why DebugView Might Appear Empty
A common annoyance when first using DebugView is opening it up and seeing… nothing. But that does not always mean your tracking is configured incorrectly. Usually, it can happen for the following reasons:
- You haven’t activated debugging mode.
- You’re using an IP address that is filtered out.
- Browser extensions or blockers are interrupting the data being sent to GA4.
Consider DebugView as a filtered view (think of it like a lens). Until you explicitly inform GA4 about the events you want to see, you will see nothing on the stream.
How to Enable GA4 Debugging
Now we can identify the most accessible way to turn on debugging.
Via Google Tag Assistant
The easiest way to do it is via Google Tag Assistant. Here are the steps:
- Add the Tag Assistant extension to Chrome.
- Enable it on your site and reload the site.
- Verify if any GA4 requests are being sent in Real-time.
Tag Assistant adds the debugging parameters to any requests, which are then shown in DebugView. It also highlights implementation errors, such as misconfigured tags, duplicate firing, and absent consent flags.
This is why a Google Tag Assistant guide is extraordinarily useful for anyone who takes analytics seriously! Not only does it confirm GA4 tags, it highlights other scripts running on your page and offers fast insights!
Using the GA4 DebugView Directly
If you prefer something more native, DebugView is very powerful. Once you enable it, you can monitor:
- A timeline of user interactions.
- Events that happen, such as page views, scrolls, or purchases.
- Parameters such as page location, transaction ID, or campaign source.
Debugging directly in GA4 can be especially useful when testing significant milestones such as checkout flows or form submission processes. Seeing those events fire in real-time lets you know you are not missing conversions.
Adding Debug Mode Manually
For those who want the most control, you could manually pass a debug parameter:
- In Google Tag Manager (GTM), you would set debug_mode=true in your GA4 configuration or event tag.
- If you are using gtag.js directly, you would include the same parameter in your code.
This approach is generally better when you want to test in specific environments or for specific events. At this point, you can see the gtag vs gtm argument, where GTM is flexible and allows you to manage multiple tags with different conditions, but gtag is more lightweight and less configurable.
Fixing GA4 Tracking Issues
It is part of reality that even the best setups run into problems. The good news is that with these first-party tools, you’ll be able to quickly fix GA4 tracking. Here are some common scenarios:
- Duplicate events: The debugging tools will tell you if you are firing multiple events. This is commonly found when GTM tags are firing at the same time as hardcoded tags.
- Missing parameters: Check DebugView to determine if the event details are passing through.
- Incorrect Triggering: The Tag assistant will help identify where the firing errors are happening, so you will know if the trigger is mistakenly set up.
Irrespective of whether it is a small oversight or a large implementation issue, GA4 Debugging will help you catch it before it muddies your reports.
Pro Tips for Effective Debugging
To maximize your analytics debugging tools, take these best practices into account:
- Always use Incognito mode to avoid cache sessions or logged-in actions.
- Use GA4 DebugView and Tag Assistant at the same time: (GA4 DebugView validates event firing, Tag Assistant validates technical firing as intended)
- Document your testing steps so issues don’t repeat.
- Use Google Tag Manager best practices: consistent naming to clarify what each tag does, structure the GTM container, and version control.
Analytics debugging is not just for setup – it’s a regular practice that will keep your analytics valid the more your site deletes, changes, and evolves.
The Conclusion on GA4 Debugging
Good data is fundamental to a well-crafted digital strategy. Once you become proficient at GA4 debugging, you will rest easy knowing that every interaction on your website is being tracked as expected. Debugging analytics tools such as GA4 DebugView and Google Tag Assistant should not merely be a technical add-on – they should be perceived as your best allies in your analytics workflow.
With the analytics debugging tools, you can identify problems, validate GA4 event tracking, and fix GA4 tracking issues before they become bigger issues. Also, if you incorporate strong testing processes into your setup and use Google Tag Manager best practices, you should be able to ensure that your reporting is accurate for the long term.
As businesses use GA4 features for insights increasingly, those that invest time understanding how to debug will continually have an advantage. Whether you’re new to GA4 or want to expand your analytics setup, accuracy is imperative.
When partnering with experts, there are specialists who offer digital marketing services in UAE and beyond. A good partner enables you to focus on the strategic aspect while being confident that your analytics foundation is solid.
Related Post
Publications, Insights & News from GTECH